Page 1 of 1
OT Monitor 4.2 opentherm.dat log format changed?
Posted: Thu Jan 22, 2015 1:40 pm
by slawekj
Hello,
I run OpenTherm Monitor on my raspberry pi, and then a.o. parse opentherm.dat logs to get internal unit temperatures.
I noticed that after upgrade to 4.2 version, the opentherm.dat log format has changed, and does not include all interesting values.
example 4.2 log:
1;1;0;1;0;0;;20.15;22.16;29.00;75.45;53.87;45.00;60.00;90.00;20150122;12:21:30
example 4.0 log:
1;0;1;1;0;0;;20.22;22.15;3.00;44.96;40.40;45.00;60.00;90.00;58.00;0;0;0;0;100.00;255;0;0;0;0;0;1;0;0;20150122;12:31:30
Is this possible to revert to the previous format, or I am supposed to use 4.0?
BTW. I haven't been able to get the "Graph" data in web interface on my raspberry pi.
Thanks.
Re: OT Monitor 4.2 opentherm.dat log format changed?
Posted: Thu Jan 22, 2015 6:11 pm
by hvxl
slawekj wrote:I noticed that after upgrade to 4.2 version, the opentherm.dat log format has changed, and does not include all interesting values.
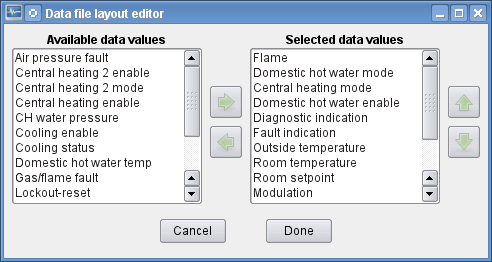
Then add whatever values you find interesting.
See also
this topic.
Re: OT Monitor 4.2 opentherm.dat log format changed?
Posted: Thu Jan 22, 2015 7:17 pm
by slawekj
Thanks!
I haven't noticed the new options, because I use OT Monitor from command-line. And haven't found the thread you mentioned before (despite I tried to search the forum).
I guess I will have to put appropriate entries in .otmonitor-4rc?
And how about the Graph function in web interface? Any clues of what would be the problem?
I have tried various browsers with no luck - IMHO the file returned by server (graph.svg) does not include any data except the grid. I have attached it.
Re: OT Monitor 4.2 opentherm.dat log format changed?
Posted: Thu Jan 22, 2015 11:08 pm
by hvxl
Yeah, that graph is empty. You're sure it was made with otmonitor 4.2? I just tested it again and otmonitor 4.2 on a Raspberry Pi in daemon mode produces a correct graph for me.
Re: OT Monitor 4.2 opentherm.dat log format changed?
Posted: Fri Jan 23, 2015 12:21 am
by slawekj
The previously attached one was made with OT Monitor 4.0 (haven't managed to reconfigure logs yet), but the same problem is with 4.2.
After further investigation, I just noticed that the problem is only when I run the otmonitor from script:
#!/bin/bash
/home/pi/opentherm/otmonitor-ahf -w 8081 --daemon -d opentherm.dat -a /dev/ttyOT &
the exact same command executed directly from console - the graph is properly displayed.
Do I make a mistake in my script, or is there any workaround?
Thanks.
Re: OT Monitor 4.2 opentherm.dat log format changed?
Posted: Fri Jan 23, 2015 10:05 pm
by hvxl
Are you sure it really is the exact same command? There is no reason the program would behave differently when started from a script. Are you possibly running a different binary from the command line and the script still uses an old one? The graph not being filled is a known problem of pre-4.2 versions of otmonitor, so you really need 4.2 if you want this functionality.
What is the size of /home/pi/opentherm/otmonitor-ahf? For 4.2 it should be 4483929.
You can also create a file called /home/pi/opentherm/html/version.html.tmpl that contains:
Then when you access
http://raspberrypi:8081/version.html with your browser it will tell you the otmonitor version.
Re: OT Monitor 4.2 opentherm.dat log format changed?
Posted: Fri Jan 23, 2015 11:28 pm
by slawekj
I'm sorry, you are absolutely right! My mistake - in my scripts I use links to binaries (ln), and I have used wrong link to otmonitor-ahf 4.0

.
The graph works, and I have loaded the extended log configuration to 4.2 with -f option and proper datalog {} entries.
Thank you for your help, and sorry again for my mistake.
Re: OT Monitor 4.2 opentherm.dat log format changed?
Posted: Sat Jan 24, 2015 11:07 am
by hvxl
No worries. Thanks for reporting back that the issue is solved and not leaving me to wonder what happened.